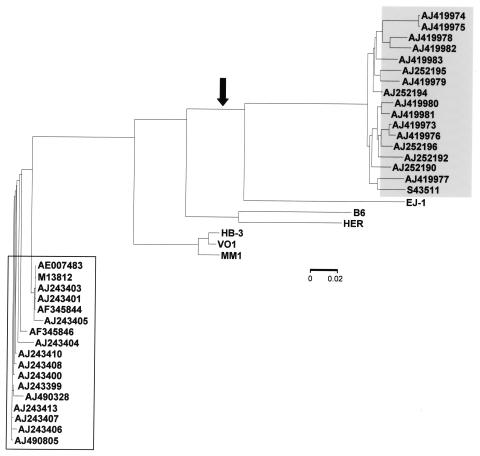
FIG. 5.
Phylogenetic tree of the bacterial and phage lytA alleles. The neighbor-joining phylogenetic tree (phylogram) shows the evolutionary relationships between lytA alleles. Open and gray boxes indicate the positions of typical and atypical bacterial alleles, respectively. They are identified by their accession numbers. The arrow indicates the event causing the 6-bp deletion characteristic of atypical lytA alleles, including ejl. The scale represents the number of nucleotide substitutions per site.

