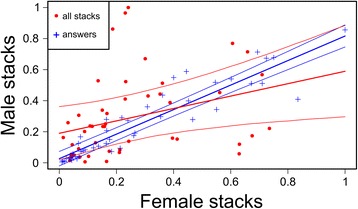
Fig. 4.

Correlation of the numbers of stack calls and answers between males and females. Total number of stack calls (red dots) and number of stack call replies to stacks (blue crosses) for males and females for each day for each pair (values are normalised dividing by the highest number of calls). Bold lines represent the relationships extracted from the estimated posterior of the linear mixed models; thinner lines are the respective 95% credible intervals. Number of answers is tightly correlated between males and females, while call number is only loosely correlated, indicating that different individuals use differing proportions of calls to answer the partner
