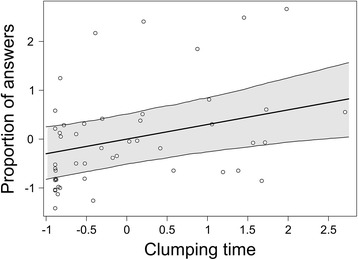
Fig. 5.

Correlation between proportion of male answers and time spent in physical contact. Amount of time in physical contact and proportion of answers (standardised by z-scores). The dots are the raw values, one point for each male each day, the bold line is the fitted regression line drawn from the posterior distribution of the value estimated from the LMM. The thinner lines and the shaded area represent the credible intervals
