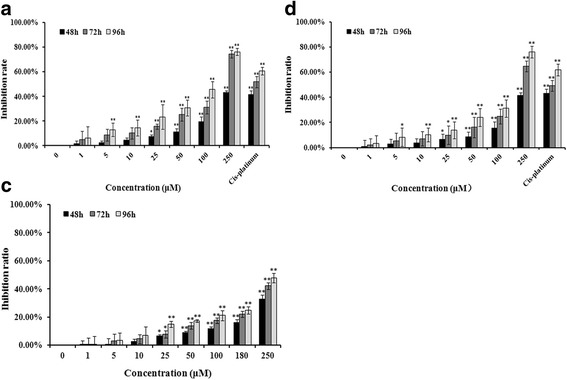
Fig. 2.

Assessment of apoptosis by MTT assay. a The inhibition ratio of HeLa cells after treated with cinchonine for 48, 72, and 96 h. b and c represented A549 and NHDF cells. Quantitative analysis of MTT represented as the mean ± SD of three independent experiments. *P < 0.05 and **P < 0.01 when compared to untreated control
