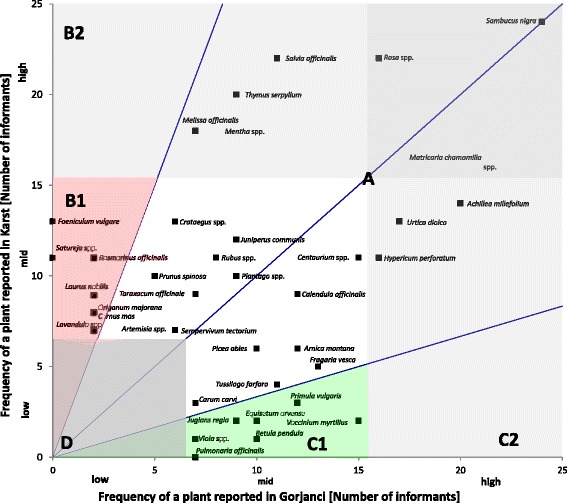
Fig. 2.

Comparison of the frequency distribution of plants reported by 25 informants in Gorjanci and 25 informants in Karst. Frequencies below 7 are considered low, those from 7 to 15 mid, and those from 16 to 25 high. Plants that were reported by at least 7 informants in one region are represented by a dot with the plant’s scientific name. Due to the high number of plants, those with frequencies lower than 7 in both regions are not represented by a dot; they lie in section D. The middle blue line represents plants with equal frequencies in both regions. The other blue lines represent plants with frequencies that were threefold higher in one region than in the other
