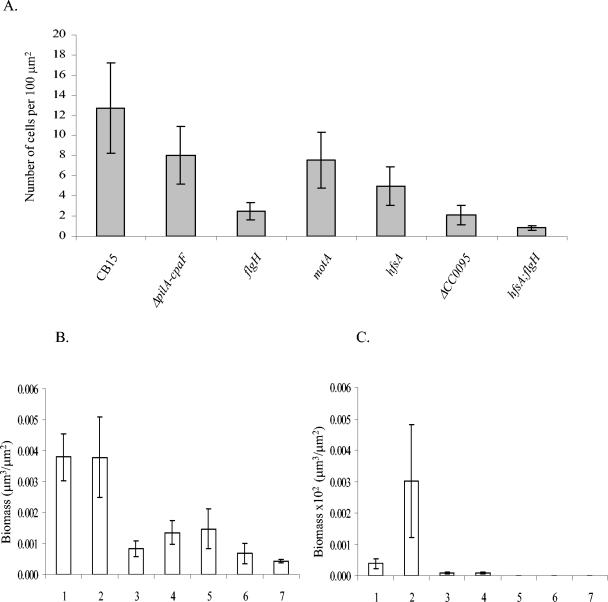
FIG. 7.
Attachment of C. crescentus cells to a glass surface. (A) Number of cells attached to the substrate per 100 μm2 after 24 h. (B and C) Quantitative COMSTAT analyses of biofilms: C. crescentus CB15 (lanes 1) is compared with ΔpilA-cpaF::Ωaac3 (AS111) (lanes 2), flgH (AS114) (lanes 3), motA (AS115) (lanes 4), hfsA (AS113) (lanes 5), ΔCC0095 (AS121) (lanes 6), and double hfsA flgH (AS118) (lanes 7) mutants. Biomass (in cubic micrometers per square micrometers) was determined at 24 h (B) and 96 h (C). Note the difference in the ordinate scales in panels B and C, respectively.

