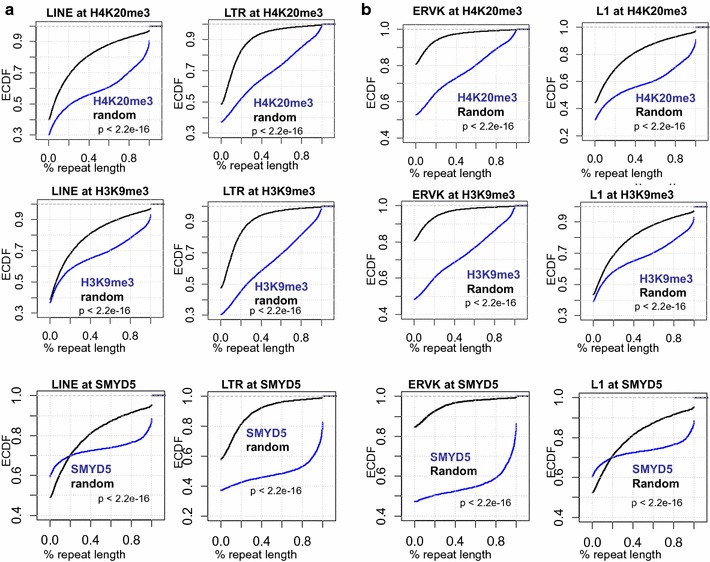
Fig. 5.

SMYD5 and H4K20me3 occupy repetitive DNA elements in ES cells. Comparison of H4K20me3, H3K9me3, and SMYD5 enriched sequences and annotated repetitive sequences (http://www.repeatmasker.org). Empirical cumulative distribution (ECDF) for the percent coverage of a a LINE or LTR repeat class or b family member (L1 or ERVK) across all H4K20me3 (top) or H3K9me3 (middle) islands, or SMYD5 regions (bottom) relative to random genomic regions (black). Y-axis shows the percentage of genes that exhibit a percent repeat length less than the value specified by the x-axis. A line shifted to the right means a systematic increase in the percent coverage of a repeat element in ChIP-Seq peaks relative to random genomic sequences. p value for all <2.2e−16 (Kolmogorov–Smirnov test)
