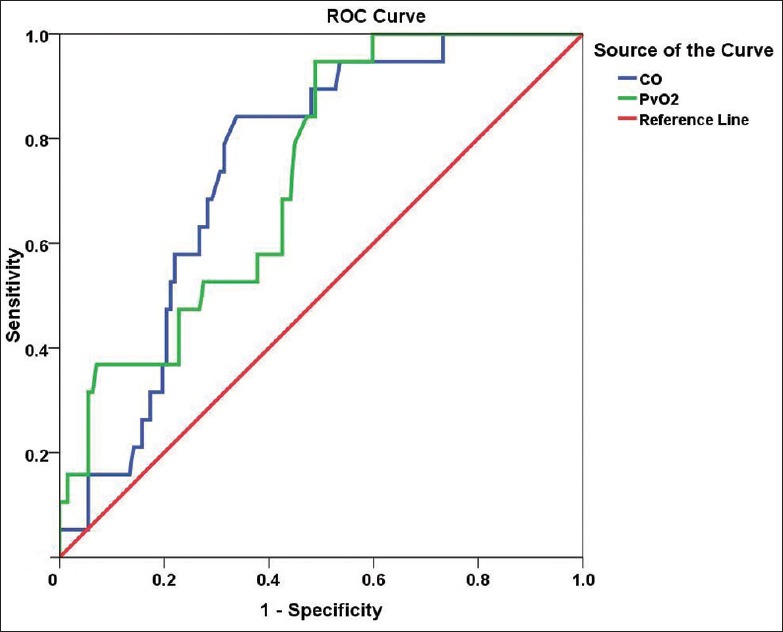
Figure 3.

ROC curve derived from the logistic regression analysis of levels of CO and PvO2 for predicting a positive response to AVT in patients with CTEPH. Note: the CO curve is blue and the PvO2 curve is green. ROC analysis for CO (P = 0.001): area under the ROC curve, 0.745; sensitivity, 84.2%; specificity, 66.1% for a cutoff of 3.475 L/min. ROC analysis for PvO2 (P = 0.001): area under the ROC curve, 0.730; sensitivity, 94.7%; specificity, 51.2% for a cutoff of 35.150 mmHg. AVT: Acute vasoreactivity testing; CO: Cardiac output; CTEPH: Chronic thromboembolic pulmonary hypertension; ROC: Receiver operating characteristic; PvO2: Mixed venous oxygen partial pressure.
