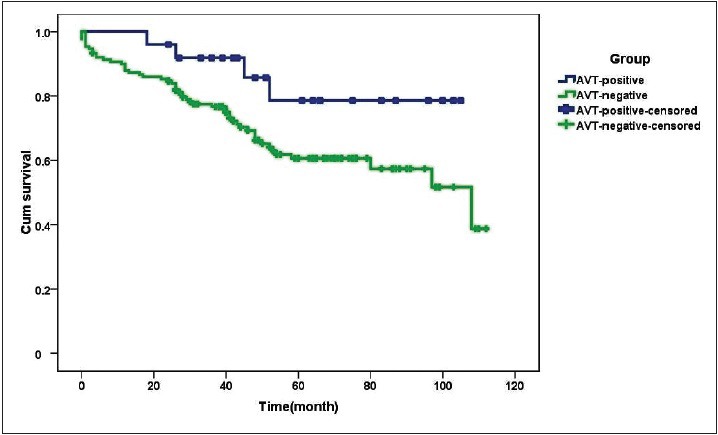
Figure 4.

Survival curves of patients with CTEPH with a positive and negative response to AVT (n = 175). The curve for AVT responders is blue, whereas that for AVT-nonresponders is green. The follow-up data were analyzed using Kaplan-Meier survival curves and the log-rank test. The survival time in patients with a negative response to AVT was somewhat shorter than that in AVT-responders although the difference was not statistically significant (χ2 = 3.613, P = 0.057). AVT: Acute vasoreactivity testing; CTEPH: Chronic thromboembolic pulmonary hypertension.
