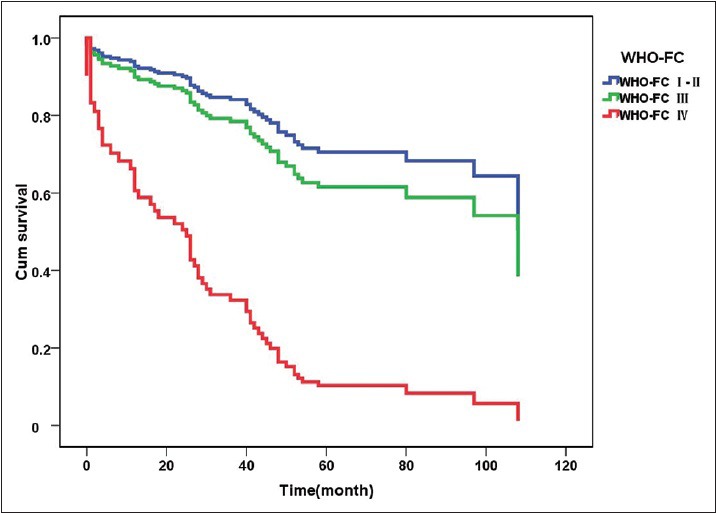
Figure 6.

Survival curves of patients with CTEPH with different WHO-FC (n = 175). The curve for WHO-FC I–II is blue, the curve for WHO-FC III is green, and the curve for WHO-FC IV is red. A Cox regression model was used for multivariate analysis of survival time of patients with CTEPH. WHO-FC was the strongest factor affecting survival time of patients with CTEPH, with the risk of death in patients with WHO FC I–II significantly lower than that in patients with WHO-FC III or IV (WHO-FC I–II versus WHO-FC III: RR = 0.108, 95% CI: 0.045–0.258, P < 0.001; WHO-FC I–II versus WHO-FC IV: RR = 0.147, 95% CI: 0.062–0.347. P < 0.001). CTEPH: Chronic thromboembolic pulmonary hypertension; WHO-FC: World Health Organization functional class. RR: Relative risk; CI: Confidence interval.
