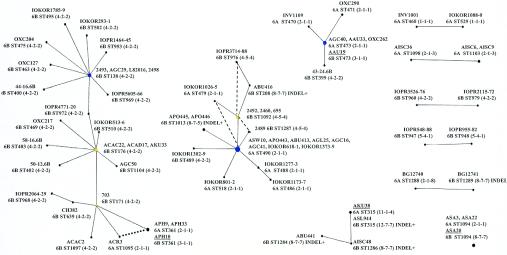
FIG. 5.
eBURST groups among the serogroup 6 isolates. The eBURST algorithm (9) was applied to the 102 serogroup 6 isolates. STs that were not part of clonal complexes (singleton STs) are not shown, except in the case of ST1094, where the three isolates of this ST varied in serotype. The circles represent the individual STs, and the size of the circle indicates the abundance of the ST in the input data. STs linked by a line differ at a single MLST locus (i.e., they are SLVs). The isolate name is shown for each ST, followed by the serotype and cps profile. The presence of the indel between the wciO and wciN genes is also indicated. Where there are multiple isolates of an ST, the serotypes and cps profiles are the same unless otherwise indicated. Isolates of the same ST but different serotypes are underlined. ST1095 is an SLV of ST361, as well as of ST171, and taking account of the cps profiles of the isolates, the descent from ST361 to ST1095 (shown by the dotted line) is more parsimonious than the alternative descent from ST171 to ST1095 suggested by the eBURST algorithm. The dashed lines in the ST490 clonal complex identify STs that are double-locus variants, and taking account of the observed cps profiles, suggest possible alternative pathways of descent where the postulated intermediate SLVs are lacking.

