Figure 3.

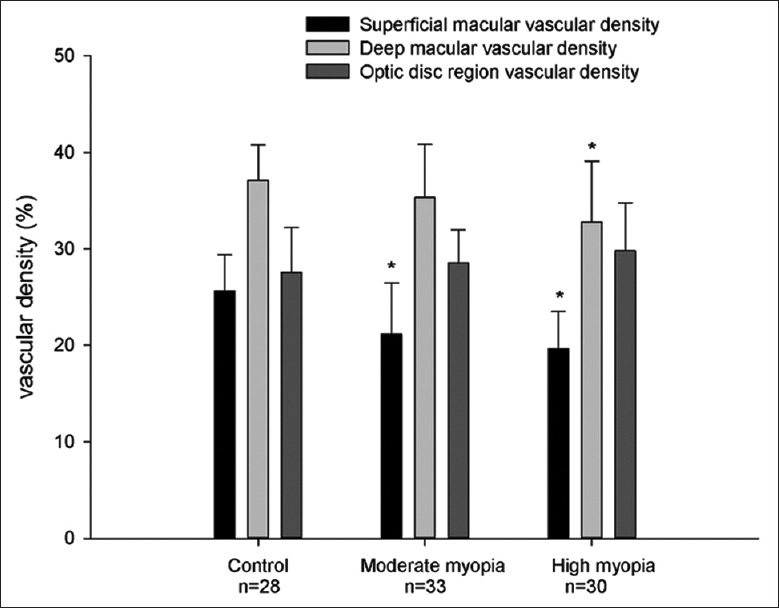
Bar charts showing the superficial macular vascular density and deep macular vascular density in control, moderate myopic, and high myopic groups. *P < 0.01 compared to control group, Least Significant Difference test.

Bar charts showing the superficial macular vascular density and deep macular vascular density in control, moderate myopic, and high myopic groups. *P < 0.01 compared to control group, Least Significant Difference test.