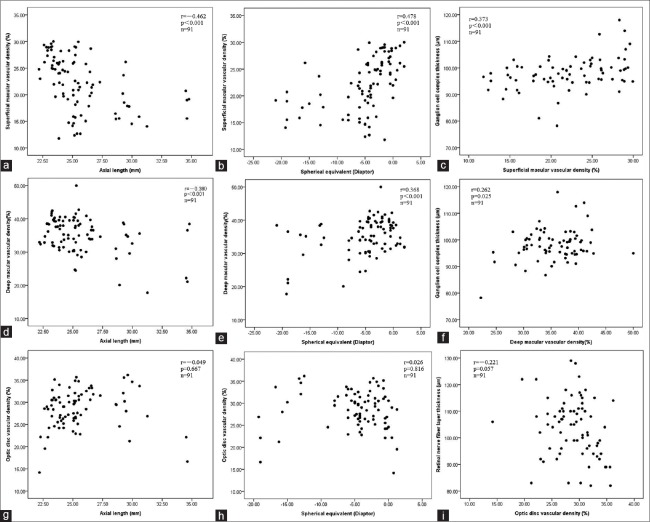
Figure 4.
Scatterplots showing the correlation between superficial macular vascular density and axial length (a) spherical equivalent (b) ganglion cell complex thickness (c) deep macular vascular density and axial length (d) spherical equivalent (e) ganglion cell complex thickness (f) papillary vascular density and axial length (g) spherical equivalent (h) retinal nerve fiber layer thickness (i). r is the correlation coefficient and P values were calculated by Pearson's correlation.

