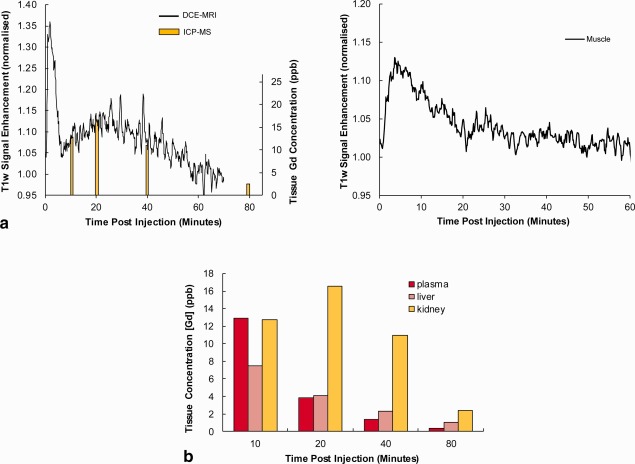
Figure 3.

Biodynamics of [Gd.L1]− in vivo. (a) MRI signal intensity curves obtained from selected ROIs using a DCE‐MRI sequence. (b) Measurements of tissue Gd concentration based on invasive tissue sampling. The kidney data (yellow) are shown overlaid onto the DCE‐MRI signal curve (a, left) to illustrate the similarity in time course (despite being in different animals).
