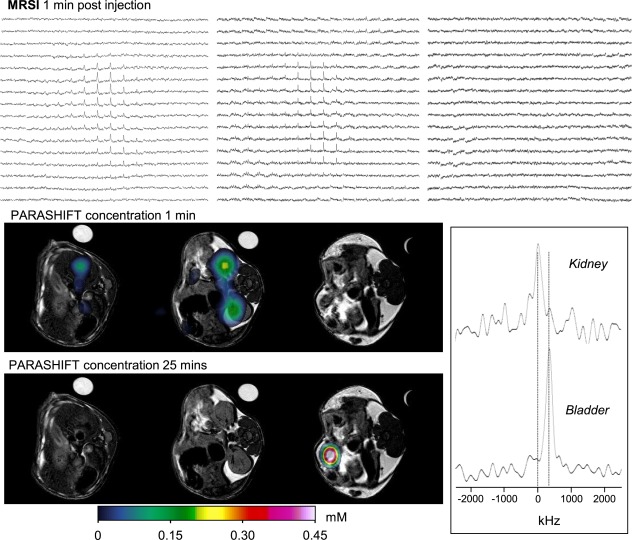
Figure 7.

In vivo PARASHIFT dual imaging experiment showing contrast agent distribution as a function of time and tissue temperature assessment based on the frequency dependence of the PARASHIFT signal. Data were collected using a 3DSI sequence providing a four‐dimensional data set (three spatial and one spectral). The image panel presents the spectral grids for three of the MRSI slices acquired 1 min after intravenous injection (upper row), with the same data displayed as the reconstructed PARASHIFT tissue distribution (derived from the peak area for each voxel in the 3DSI experiment) overlaid on the anatomical scans (middle row). The tissue concentration data at 25 min post injection are shown in the bottom row. The anatomical scans were collected before contrast injection and show the location of the PARASHIFT filled tube used for system calibration and as a concentration reference. This sample tube was withdrawn remotely from the FOV before injection and therefore does not appear in the PARASHIFT images. PARASHIFT frequency is temperature‐dependent and can be used to map temperature differences. Spectra (lower right panel) were extracted from selected regions of interest in kidney at the 1‐min time point and from the bladder at the 25‐min time point and corrected for differences in Bo field strength in each region based on the water signal frequency. Significant changes in signal frequency (temperature) are apparent over time between the kidney and bladder.
