Figure 1.

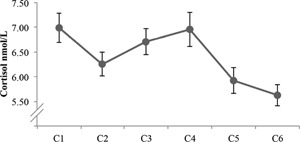
Cortisol concentrations (nmol/L) per measurement moment. Error bars represent one standard error above and beneath the mean at each measurement moment

Cortisol concentrations (nmol/L) per measurement moment. Error bars represent one standard error above and beneath the mean at each measurement moment