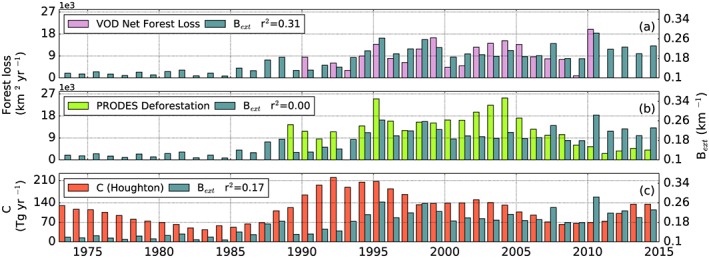
Figure 8.

Annual estimates of fire emissions and forest loss for the whole study region (Figure 2). In all plots dark green indicates the annual averaged visibility‐based B ext (1974–2014), which are compared with (a) VOD‐based net forest loss (1990–2010), (b) summed PRODES deforestation for the provinces of Acre, Mato Grosso, Rondônia, Pará, and Tocantins (1989–2014, and (c) averaged FAO emissions attributed to deforestation fires for Brazil and Bolivia.
