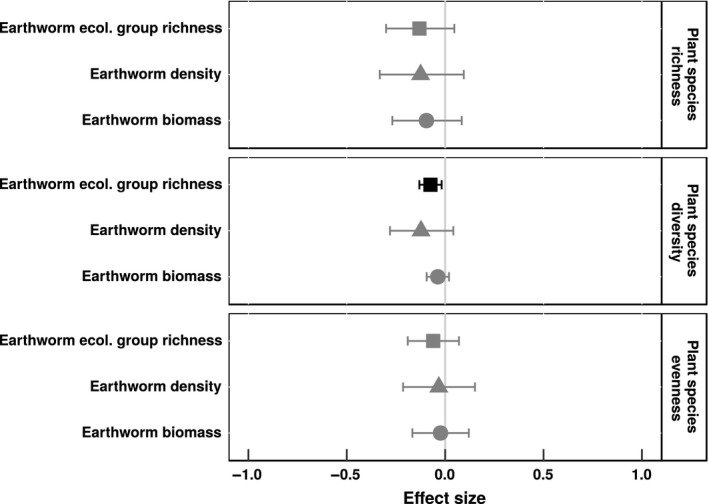
Figure 1.

Mean effect sizes of relationships between introduced earthworm communities and plant species richness, diversity, and evenness of forest understory communities in North America. Whisker bars are 95% confidence intervals: Black whisker bars did not overlap with zero. Mean effect sizes are Pearson's correlation coefficients. Plant species diversity was calculated using Shannon–Wiener diversity, and plant species evenness was calculated using Evar (Smith & Wilson, 1996). Earthworm biomass is biomass of introduced earthworms (g m−2), earthworm density is number of introduced earthworms (individuals m−2), and earthworm ecological group richness is the number of introduced earthworm ecological groups.
