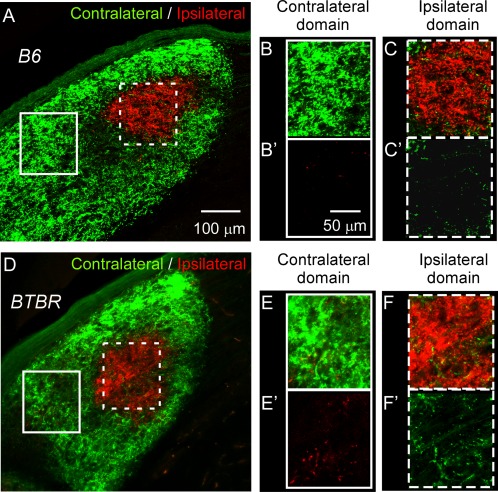
Figure 5.

Aberrant projections in the dLGN of the BTBR animals. dLGN from P30 B6 (A–C2) or BTBR (D–F2) mice. Boxed regions in lower magnification images (A and D) correspond to higher magnification images on the right with boxes of the same style (B–C2 and E–F2, respectively). Boxes with solid white line show examples of the contralateral domain, while boxes with dotted white line show the ipsilateral domain. Only the ipsilateral input (red signal) is shown in (B2) and (E2); similarly, only the contralateral input (green signal) is shown in (C2) and (F2). There were increased ipsilateral projections within the contralateral domain in the BTBR mice (E and E2) compared to the B6 mice (B and B2). Similarly, there were increased contralateral projections within the ipsilateral domain in the BTBR mice (F and F2) compared to the B6 mice (C and C2). Scale bar in (A) and (D): 100 μm, in (B–C2) and (E–F2): 50 μm.
