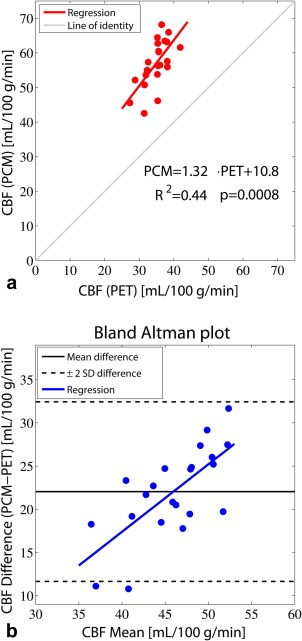
Figure 3.

Agreement of CBF measurements. (a) Correlation between global cerebral blood flow (CBF) measured by 15O‐H2O PET and phase‐contrast mapping (PCM) MRI. (b) Bland–Altman plot showing difference against mean of the methods. Measurement by PCM MRI resulted in higher values compared to 15O‐H2O PET. The positive slope of the regression line of the Bland–Altman plot was significantly different from zero (P = 0.0014), indicating a perfusion‐dependent relative difference between CBF values obtained by the two methods.
