Figure 2.

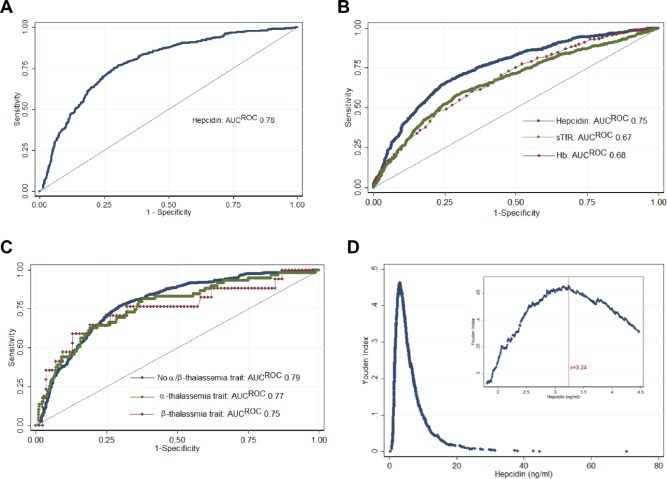
ROC curves for hepcidin to identify iron deficiency. A, Hepcidin compared to ferritin<15 ng/mL, or <30 ng/mL if CRP>5 mg/L, and sTfR‐F index>2 (AUCROC 0.78) (n = 2203) B, using ferritin<15 ng/mL as the gold standard, comparing hepcidin (AUCROC 0.75) to sTfR (AUCROC 0.66, P < 0.001) and Hb (AUCROC 0.68, P < 0.001) (n = 2149) C, ROC curve comparing the performance of hepcidin at distinguishing iron deficiency in samples without α‐ or β‐thalassemia trait (AUCROC 0.79, n = 1620) with samples with α‐ (AUCROC 0.77, n = 468) and with β‐thalassemia trait (AUCROC 0.75, n = 101) (not significant between any group). D, Youden indices [(sensitivity + specificity) − 1] at each cutoff of hepcidin. (Inset) Youden indices in the range of 1.8–4.5 ng/mL. The maximal Youden index was 0.463 and occurred at a hepcidin cutoff of 3.24 ng/mL (sensitivity, 76.8%; specificity, 69.6%). ROC = Receiver Operating Characteristic; AUC = Area Under Curve. [Color figure can be viewed at wileyonlinelibrary.com]
