Figure 2.

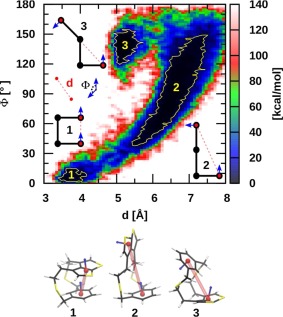
Two‐dimensional representation of the free energy landscape obtained from the REMD@DFTB3 of the dithiacyclophane molecule. The relevant collective variables are shown in the plot. 1 kcal mol−1 isocontours are shown in yellow.

Two‐dimensional representation of the free energy landscape obtained from the REMD@DFTB3 of the dithiacyclophane molecule. The relevant collective variables are shown in the plot. 1 kcal mol−1 isocontours are shown in yellow.