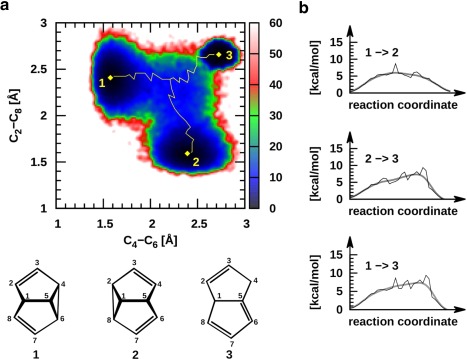
Figure 3.

Cope rearrangement of semibullvalene. a) Two‐dimensional free energy map obtained from REMD@DFTB3 simulations indicating the expected CR (minimum energy pathway, 1 ↔ 2, given in yellow) as well as an unexpected region corresponding to opening of the SBV structure to give dihydropentalene (1 ↔ 3, 2 ↔ 3). b) Qualitative plots of the minimum energy pathways between the stable conformations presented in 3a.
