
Figure 2.
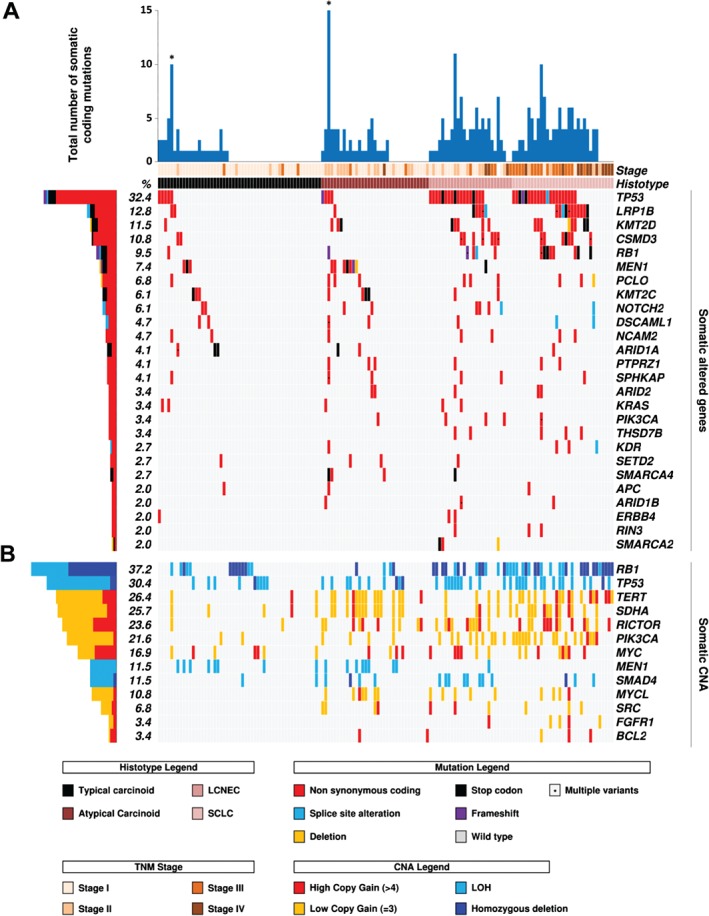
Recurrent alterations in 148 LNETs. Cases are grouped according to the four histotypes defined by the WHO classification. The histograms on the left report the alteration frequency of each gene expressed as a percentage. Alterations are annotated by different colours, according to their impact on the gene product. (A) The upper histogram shows the number of mutations in recurrently altered genes for each sample. Asterisks indicate the two hypermutated cases that emerged from WES. The matrix shows 26 genes that were mutated in at least three cases. (B) The matrix shows the copy number status of 13 genes in the whole cohort.