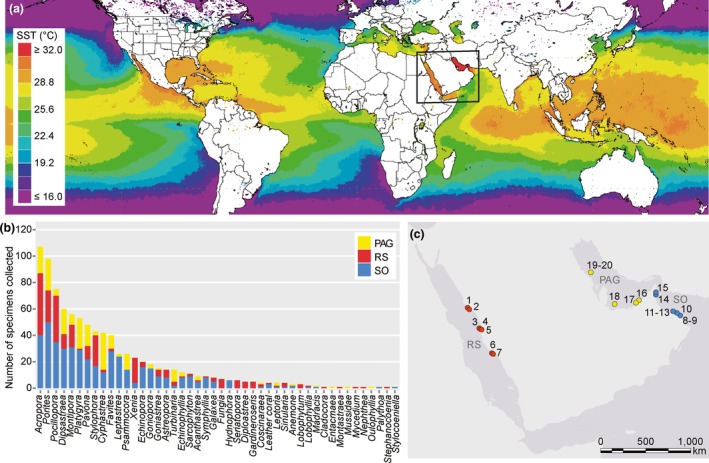
Figure 1.

Overview of study locations and coral sampling. (a) Summer sea surface temperatures (SST) mark the region around the Arabian Peninsula as comparably warm (monthly averages from 07/2012–09/2012 derived from satellite data sets of the NASA Giovanni online data system, Ocean Colour Radiometry, MODIS‐Aqua 4 km, black rectangle denotes sampling region). (b) Cumulative number of coral samples per genus collected from the Red Sea (RS, red), the Sea of Oman (SO, blue), and the Persian/Arabian Gulf (PAG, yellow), total n = 892. (c) Sampling sites around the Arabian Peninsula; samples from the Red Sea were collected at Yanbu Ayona (1, 36 samples), Yanbu 23 (2, 31 samples), Shib Nazar (3, 43 samples), Al Fahal (4, 42 samples), Inner Fasr (5, 31 samples), Abu Lath Shallow Reef (6, 40 samples), and Al Lith South Reef (7, 33 samples). Collection sites in the Sea of Oman included Bandar Al Khayran (8, 90 samples), Shiekh Al Sifah (9, 87 samples), Fahal Island (10, 62 samples), Daymaniyat Islands (11–13, 35, 36, and 58 samples), Al Aqah (14, 34 samples), Dibba Rock (15, 37 samples), and in the Persian/Arabian Gulf Ras Ghanada (16, 26 samples), Saadiyat (17, 42 samples), Al Yassat (18, 33 samples), Subri (19, 73 samples), and Chandelier (20, 23 samples). [Colour figure can be viewed at wileyonlinelibrary.com]
