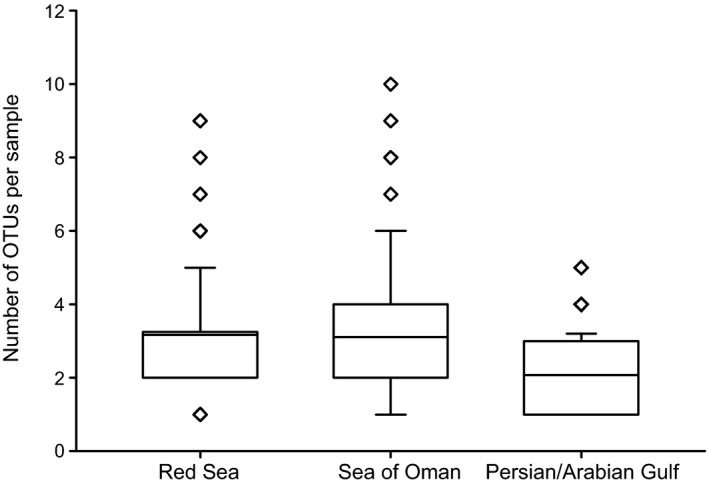
Figure 6.

Box plot displaying the average number of OTUs per specimen collected from seven coral genera (Acropora, Dipsastraea, Montipora, Pavona, Pocillopora, Porites, Stylophora) in the Red Sea (n = 166), the Sea of Oman (n = 140), and the Persian/Arabian Gulf (n = 87). Center lines show the means; box limits indicate the 25th and 75th percentiles; whiskers extend to 5th and 95th percentiles, outliers are represented by diamonds.
