
Figure 2.
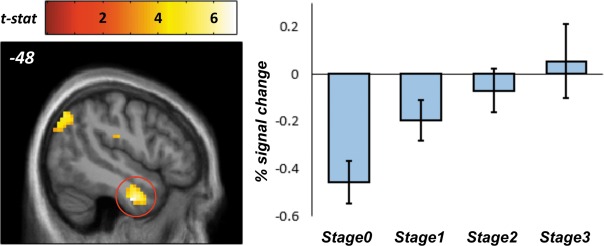
Left panel: Cluster in the left inferior temporal gyrus (ITG) exhibiting linear increases in activity as a function of the number of learnt discriminations. Right panel: Bar chart illustrating the ITG effect. Because the plot shows data selected by a whole‐brain analysis, the bars are a biased representation of the true effect size in this region. Error bars indicate 95% confidence intervals. [Color figure can be viewed at wileyonlinelibrary.com]