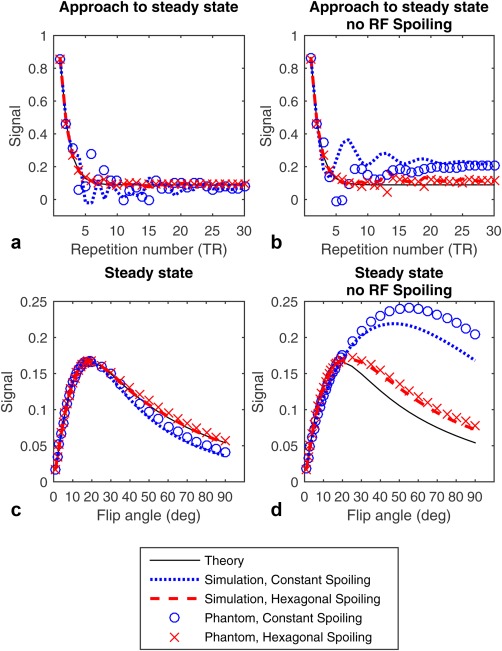
Figure 2.

Plots of the real part of the signal amplitude expected from textbook theoretical equations, simulation, and phantom measurement. The plots shown are for a 60 ° excitation; the steady state in simulation is the 60th repletion and in measurement the 176th. Approach to the steady state with and without RF spoiling, respectively (a and b); steady state with and without RF spoiling, respectively (c and d).
