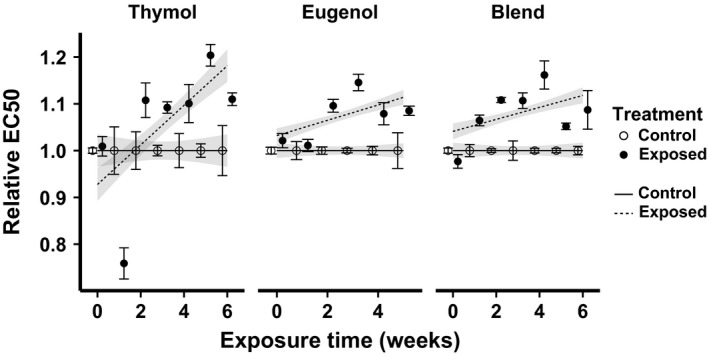
Figure 2.

Phytochemical exposure treatments increased phytochemical resistance in Crithidia bombi. The x‐axis shows the cumulative duration of exposure to phytochemical treatments. The y‐axis shows EC50 (phytochemical concentration resulting in 50% of maximal growth inhibition), standardized relative to the mean of the control lines at the corresponding time point. Points and error bars show mean ± SE (n = 3 lines per treatment). Lines and shaded bands show predicted means ± SE from linear mixed model fits. Open circles and solid lines: control treatment; filled circles and dashed lines: phytochemical exposure treatment.
