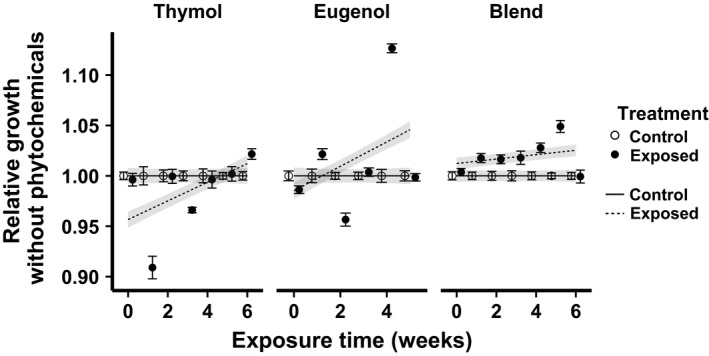
Figure 3.

Growth without phytochemicals (i.e. at phytochemical concentration of 0 ppm) during each week's EC50 assays. The x‐axis shows the cumulative duration of exposure to phytochemical treatments. The y‐axis depicts growth in the absence of phytochemicals, standardized relative to the mean of the control lines at the corresponding time point. Points and error bars show mean ± SE [n = 6 (thymol and blend) or eight (eugenol) wells each of three lines per treatment]. Lines and shaded bands show predicted means ± SE from linear mixed model fits. Open circles and solid lines: control treatment; filled circles and dashed lines: phytochemical exposure treatment.
