
Figure 5.
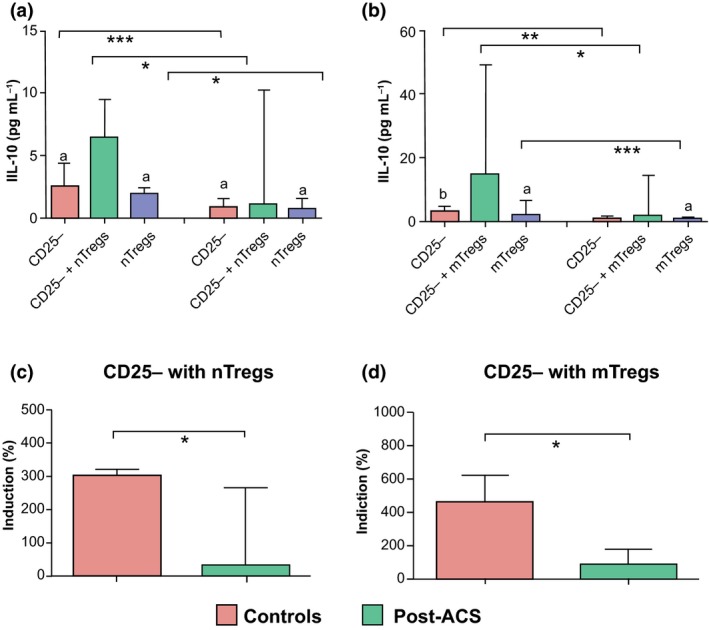
IL‐10 secretion assays were performed in samples from control subjects (n = 10) and post‐acute coronary syndrome (ACS) patients (n = 9). Cells were stimulated with plate‐bound anti‐CD3/CD28 for 3 days and IL‐10 was measured in the supernatant. Secretion of IL‐10 in T responder cells alone, coculture of T responder cells with nTregs (1 : 1) and nTregs alone (a), in T responder cells alone, cocultures of T responder cells with mTregs (1 : 1) and mTregs alone (b). Percentage increase in IL‐10 secretion in cocultures of T responder cells with nTregs (c) and mTregs (d). Data are presented as median (interquartile range). Within‐group differences (a and b): a P < 0.05, b P < 0.01. Between‐group differences (a–d): *P < 0.05, **P < 0.01, ***P < 0.001.