Figure 1.

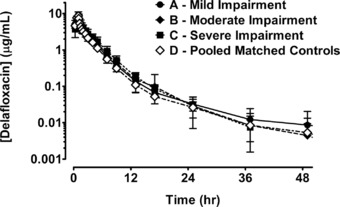
Mean (± SD) plasma concentrations of delafloxacin (μg/mL) vs time profiles by hepatic group: group A mild (●), group B moderate (♦), group C severe (■), and pooled matched controls (◊).

Mean (± SD) plasma concentrations of delafloxacin (μg/mL) vs time profiles by hepatic group: group A mild (●), group B moderate (♦), group C severe (■), and pooled matched controls (◊).