Figure 2.

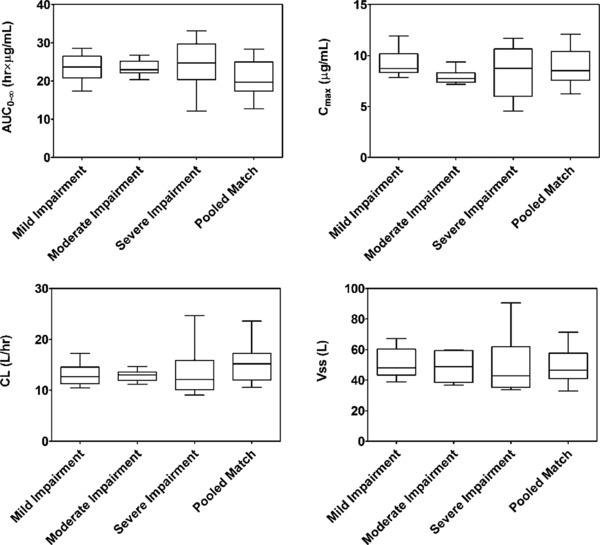
Box‐and‐whisker plots of mean delafloxacin AUC0‐∞, Cmax, CL, and Vss values by hepatic function. The whiskers represent the 5th and 95th percentiles.

Box‐and‐whisker plots of mean delafloxacin AUC0‐∞, Cmax, CL, and Vss values by hepatic function. The whiskers represent the 5th and 95th percentiles.