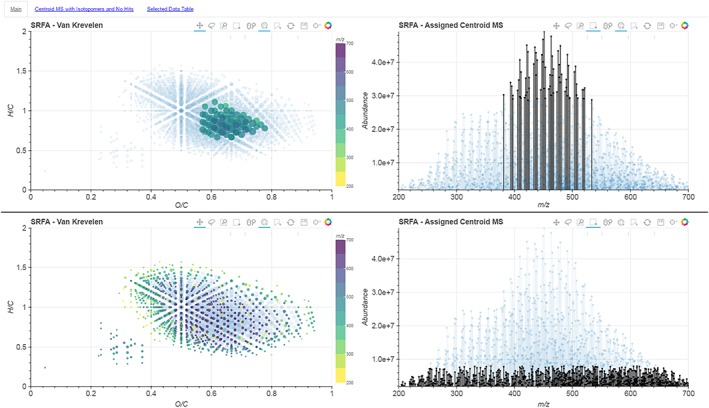
Figure 2.

Screenshots of the van Krevelen and centroid mass spectrum plots with two different selections of data points. The top frame shows that the selection of the most abundant ions only represents a small range of chemical diversity on the van Krevelen plots, whilst the bottom frame shows that the least abundant ions, “the grass”, represent the true chemical diversity of the spectrum. [Colour figure can be viewed at wileyonlinelibrary.com]
