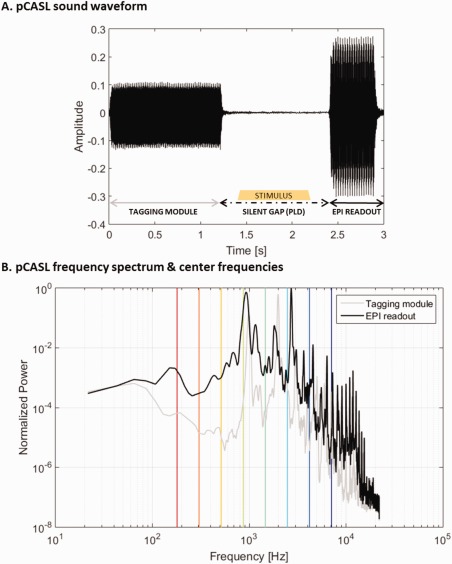
Figure 1.

Sound waveform (A) and frequency spectrum (B) of pCASL with 2D single‐shot EPI acquisition. In Panel A, the different components of a pCASL TR are illustrated: the tagging module, the silent gap (PLD; in which a stimulus sound may occur following the experimental design), and then the EPI‐train readout. In Panel B, the gray and black lines show the frequency spectrum of the tagging module and the EPI‐train readout, respectively. The vertical bars indicate the central frequencies of the stimuli and are color‐coded in the same manner as the tonotopic maps (i.e., from red‐to‐green‐to‐blue for low‐to‐medium‐to‐high frequency). [Color figure can be viewed at http://wileyonlinelibrary.com]
