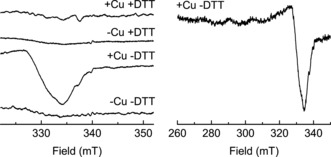
Figure 3.

X‐band (∼9.52 GHz) continuous‐wave EPR spectra of 50 μm FGE4C and 0.5 mm substrate in the absence or presence of 50 μm CuSO4 and/or 5 mm DTT. Temperature: 150 K; modulation amplitude: 1 mT; microwave attenuation: 15 dB (6.346 mW); 160 scans each. Spectra were acquired on a Bruker Elexsys 500 spectrometer equipped with a super‐high Q resonator. Left: detail of the region of the strongest CuII signal component. Right: full spectrum of the CuII species in the absence of DTT.
