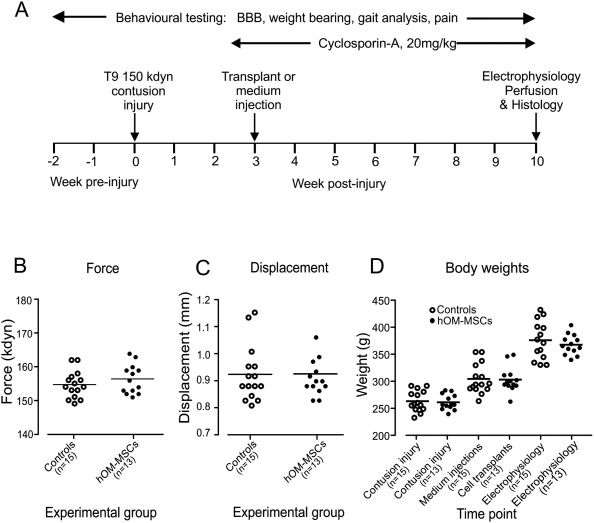
Figure 1.

Experimental design and injury parameters. (A) Schematic diagram summarizing the experimental time‐line. (B) Injury force and (C) displacement were similarly distributed for transplant and control groups and showed no significant difference (Student's t test). (D) Body weights were similarly distributed within each group throughout the study with no significant differences (Student's unpaired t test). In plots B–C horizontal bars represent mean values.
