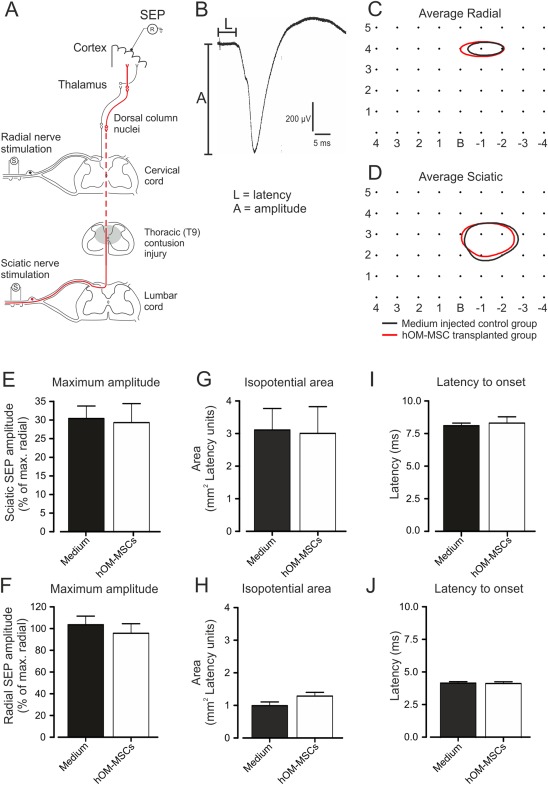
Figure 4.

Electrophysiological assessment of transmission along the ascending dorsal column pathway. (A) Schematic diagram of the electrophysiological assessment showing position of stimulating and recording electrodes in relation to pathways originating in the forelimb (radial nerve afferents) and hindlimb (sciatic nerve afferents, red lines). (B) Example of SEP evoked by stimulation of the sciatic nerve and recorded from the sensorimotor cortex (average of 30 responses). Measurements of amplitude (A) and latency (L) at each recording location. (C and D) SEP isopotential contour plots for (C) radial nerve‐evoked potentials (80% of maximum) and (D) sciatic nerve‐evoked potentials (15% of maximum). Contours represent the means constructed from isopotential plots for hOM‐MSC transplanted (red; n = 13) and medium injected (black; n = 15) animal groups. Numbers on the isopotential grids represent distances in mm relative to Bregma (B). Comparison of SEP parameters. (E and F) Maximum amplitudes of sciatic‐evoked (E), radial‐evoked (F) and SEPs expressed as a percentage of the maximum radial SEP recorded in each animal (mean + SEM). (G and H) Mean areas of isopotential contour plots encompassing areas of sensorimotor cortex within which radial and sciatic SEP amplitudes were at least 80% and 15% of the maximal radial SEP amplitude recorded in each animal, respectively. (I and J) Latency to SEP onset for sciatic‐evoked (I) and radial‐evoked (J) potentials (mean + SEM). hOM‐MSC transplanted, n = 13; medium injected controls, n = 15. There were no significant differences in SEP amplitude, area or latency between groups (Student's unpaired t tests). [Color figure can be viewed at wileyonlinelibrary.com]
