Figure 5.

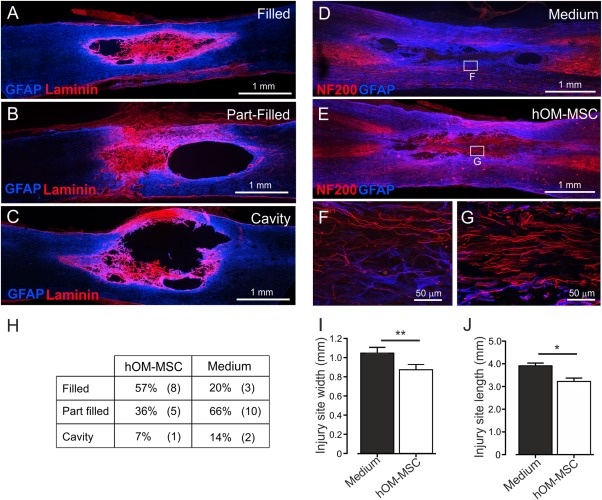
Characterisation of injury site animals following delayed transplantation into the contused spinal cord. (A–C) Confocal microscope images illustrating degrees of cavitation and extracellular matrix infilling of the injury site at 10 weeks post‐injury. Injury sites were classified as (A) filled (B) part‐filled or (C) cavity (GFAP = blue, Laminin = red). (G–J) Confocal images illustrating axonal regeneration within the cavity of (D) media injected or (E) hOM‐MSC transplanted animals (GFAP = blue, NF200 = red). F and G are higher magnification confocal images of the boxed areas in D and E, respectively. (H) Table showing incidence of each type of injury site in hOM‐MSC transplanted (n = 13) and medium injected animals (n = 15). (I) Injury site width and (J) injury site length (mean ± SEM). Injury sites were significantly less extensive in width and length in hOM‐MSC transplanted animals compared with media controls (Student's unpaired t test, **P < 0.01, *P < 0.05). [Color figure can be viewed at wileyonlinelibrary.com]
