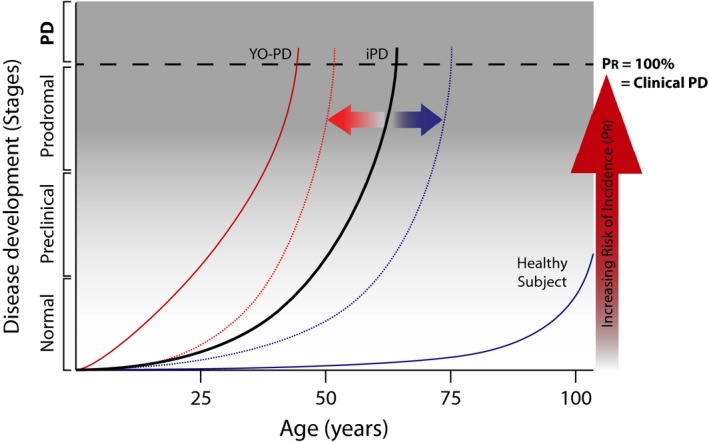
Figure 1.

PREDIGT formula calculates incidence rates for Parkinson disease in healthy adults as a function of five variables. The PREDIGT score quantifies Parkinson disease (PD) incidence rates as a function of five variables. Disease projection curves over time are plotted for a representative case of typical, idiopathic PD (iPD; solid black line), young‐onset PD (YO‐PD; solid red line) and for a healthy subject (solid blue line). Two horizontal arrows represent the effects of risk factors that either elevate (orange) or reduce (blue) cumulative PD incidence risk, and therefore, are hypothesized to shift the curve in either direction (dotted lines). Additive risk categories include ‘exposome’ (E), ‘genetics’ (DNA; D), and ‘gene–environment interactions that initiate host responses’ (I), of which the sum is multiplied by risk factors ‘sex/gender’ (G) and ‘time’ (T). Each variable is defined in detail in the text and assigned a value from a score sheet (see Table 1). This is to calculate the total PREDGIT risk score for PD incidence rate at a given time (P R score, %; vertical arrow in red). A PREDIGT score of 100% represents the onset of clinically defined parkinsonism/PD (Postuma et al., 2015) corresponding to a ≥ 60% loss in dopamine (DA) innervation of the striatum; the prodromal stage correlates with ~ 41–59% DA neuron loss; and the preclinical phase corresponds to < 40% of DA neuron loss (Chahine et al., 2016). The curve of a healthy subject is extrapolated from published calculations (Berg et al., 2015) that report the rise in ‘age‐adjusted, prior probability of PD’ to 4% at the age of 80 years. The shape of the curve after age 80 is speculative but informed by the known, age‐dependent loss of DA cells in older individuals (Fearnley & Lees, 1991; Gibb & Lees, 1991; Ma et al., 1999).
