Figure 8.

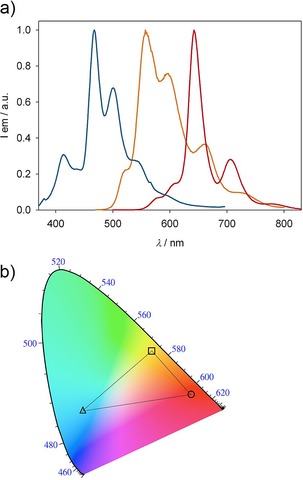
a) Emission spectra of 7Fur (blue line), 5Fur (orange line), and 6Fur (red line) in solid samples at RT. Excitation wavelength: 360 nm. b) Calculated CIE diagram for solid‐state emissions of 7Fur (triangle), 5Fur (square), and 6Fur (circle). Dotted lines are plotted to display the color gamut accessible by combination of the three solid emitters.
