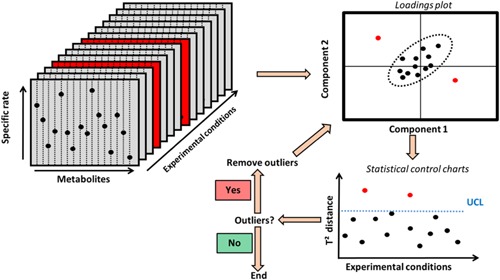
Figure 2.

Schematic representation of the data cleaning process. A principal component analysis (PCA) is performed, for each day from day 0 to 2 separately, on a pool of the specific production rates of all metabolites. The T2 Hotelling distance (Bersimis et al., 2005; Mason 1997) is then computed by assuming a multi‐normal distribution for the data. A simple statistical process control (SPC) (Bersimis et al., 2005; Mason 1997) is then used on these T2 values to identify possible outliers. This scheme is repeated until no more outlier is identified. UCL: upper control limit. This methodology has been used on day 0, 1, and 2 of the cell cultivation since the experimental conditions are similar before the feeding starts on day 3.
