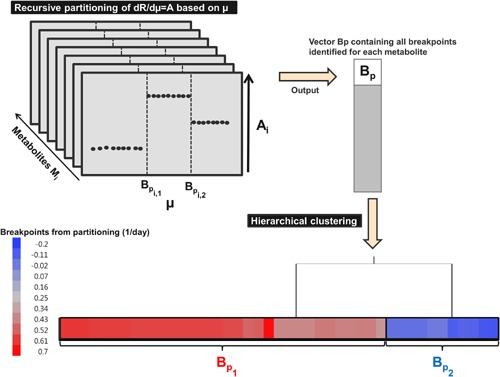
Figure 3.

Identification of the number of metabolic phase breakpoints. Hierarchical clustering was performed on the vector containing the breakpoint growth rate values identified from recursive partitioning. Each observation/breakpoint starts in its own cluster, and at each step the clustering process calculates the distance between each other cluster, and combines the two clusters that are closest together (Agglomerative procedure) (Murtagh 1983). The agglomerative procedure uses the Ward's method to calculate the distance between each cluster. The objective was to identify the number of distinct metabolic phase breakpoints required to calibrate the segmented regression model (Fig. 3). Two groups of breakpoints were identified, which correspond to two metabolic phase breakpoints BP1 and BP2. BP1 = 0.54 ± 0.06 day−1; BP2 = −0.08 ± 0.06 day−1.
