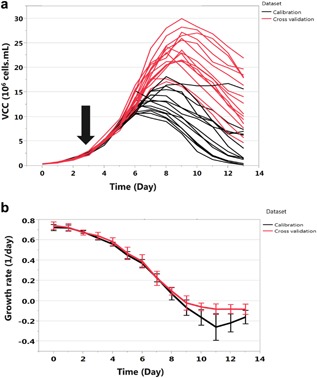
Figure 5.

Experimental viable cell count and time course of specific growth rates. (a) Growth profiles of CHO‐DG44 for 29 experimental conditions (see supplementary Table SI) with various cell growth behaviors. The cells were cultivated in a 2 L bioreactor operated in fed‐batch mode for 14 days. Black arrow: Start of nutrient feeding with a predetermined rate. (b) Specific growth rate of the 29 experimental conditions after data cleaning (Fig. 2) for the calibration dataset and the cross validation dataset.
