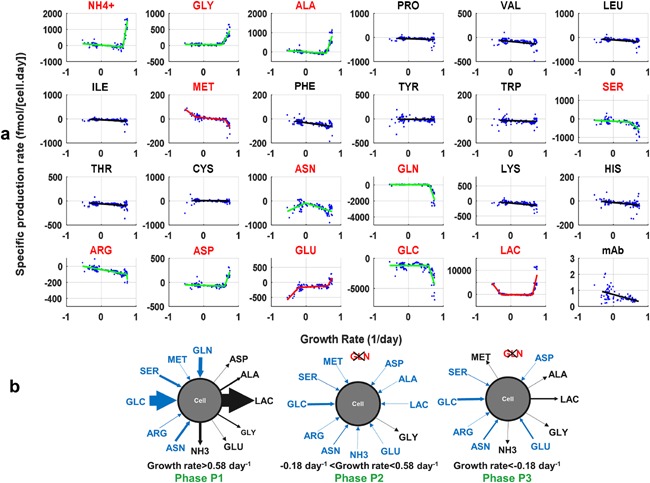
Figure 6.

Segmented regression of specific rates as a function of the growth rate. To identify metabolic phases, segmented regression was used (Fig. 4). Data of the 2 L bioreactor calibration dataset were used. Three models were set up for each metabolite, from zero up to two breakpoints. To assess whether the addition of a breakpoint makes the model prediction statistically superior to a model with a lower number of breakpoints, an F‐test was performed with 95% confidence level. (a) Segmented regression models are presented. Red names correspond to metabolites that are impacted by metabolic phases, that is which show better prediction with one to two breakpoints. When the segmented regression model is characterized by a red line, three metabolic phases were identified. Identification of two metabolic phases are characterized by a green line. (b) The 12 metabolites that were significantly impacted by metabolic phases are presented for each metabolic phase: P1, P2, and P3. Blue arrow: net uptake; Dark arrow: net secretion. The widths of the arrows are proportional to the average specific production rate values for the defined metabolic phase.
