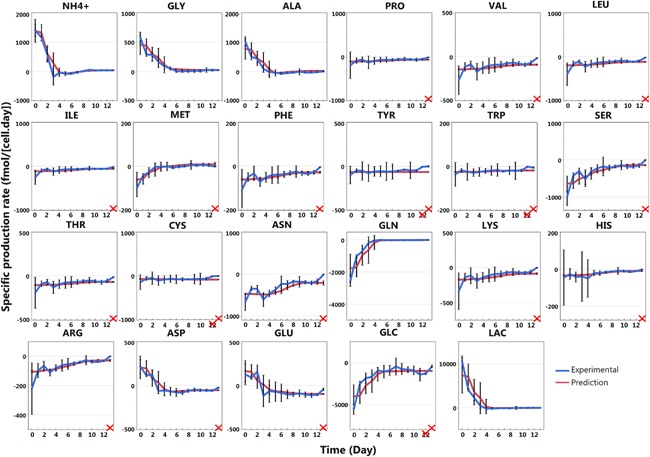
Figure 7.

Cross validation of the segmented regression models for each metabolite in 2 L bioreactor runs. The specific production rates of all metabolites for the validation dataset are presented as a function of time (day) as the specific growth rate profiles were similar (Fig. 5). The error bars correspond to 3 standard deviations. The prediction (red line) is based on the segmented regression of the calibration dataset (Fig. 6) and used the experimental specific growth rate profile (Fig. 5b) to estimate specific production rates. The prediction variability is due to the growth rate value variability and the error bars presented for the prediction correspond also to the three standard deviation. When the prediction was out of the 3 standard deviations range, the corresponding day is crossed in red.
