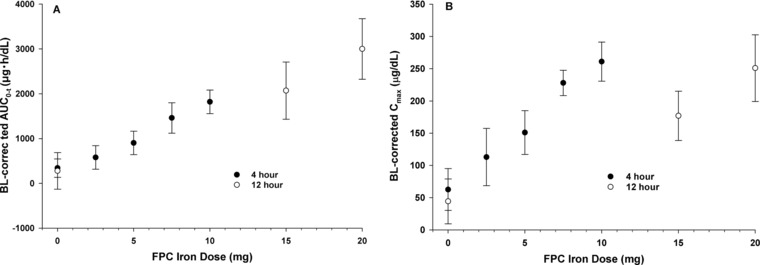
Figure 3.

Mean (SD) baseline‐corrected exposure parameters for serum total iron (sFetot) by ferric pyrophosphate citrate (FPC) iron dose. (A) Area under the concentration‐time curve from 0 to the time of the last quantifiable concentration (AUC0‐t). (B) Maximum serum concentration (Cmax).
