Figure 6.

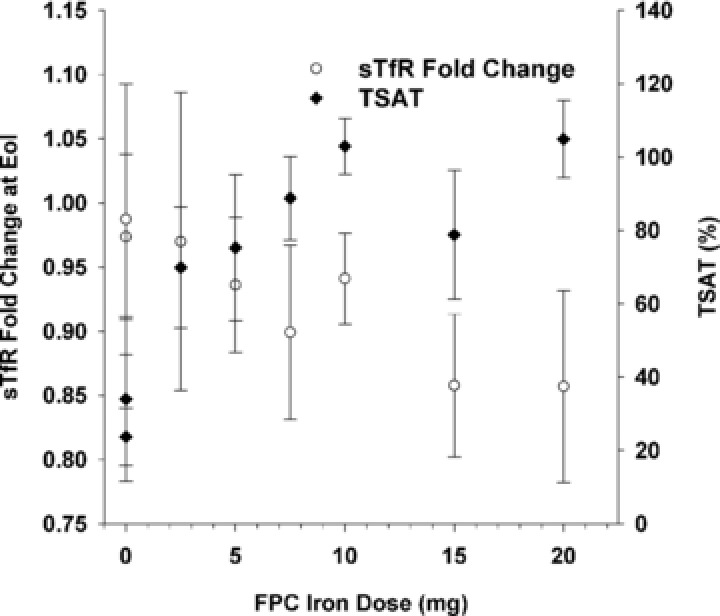
Mean (SD) fold change from baseline in serum soluble transferrin receptor (sTfR) and transferrin saturation (TSAT) at end of infusion as a function of ferric pyrophosphate citrate (FPC) iron dose.

Mean (SD) fold change from baseline in serum soluble transferrin receptor (sTfR) and transferrin saturation (TSAT) at end of infusion as a function of ferric pyrophosphate citrate (FPC) iron dose.