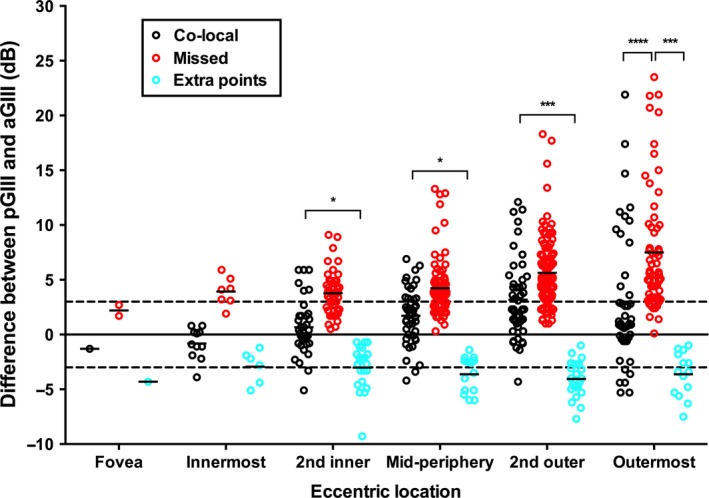
Figure 4.

The magnitude of difference between pGIII and aGIII (in dB) for individual points at each eccentric location, divided by whether there was matching (both pGIII and aGIII flagging the point below the 95% lower limit of the normal cohort, i.e. ‘co‐local’, black circles) or mismatching (either pGIII (‘missed’, red circles) or aGIII (‘extra points’, cyan circles) flagging the point). A positive difference indicates that pGIII had a higher sensitivity at that location, whilst a negative difference indicates that aGIII had a higher sensitivity. The black solid line indicates no difference (i.e. 0 dB), and the black dashed lines indicate ±3 dB. Solid lines represent the mean of the magnitude of difference within each group. As the direction has an effect on the comparative analysis between matched and mismatched groups, the absolute magnitude of the difference was used for comparison. Asterisks indicate the level of significance of the tests of multiple comparisons of the absolute differences [p < 0.05 (*), p < 0.001 (***), p < 0.0001 (****)].
