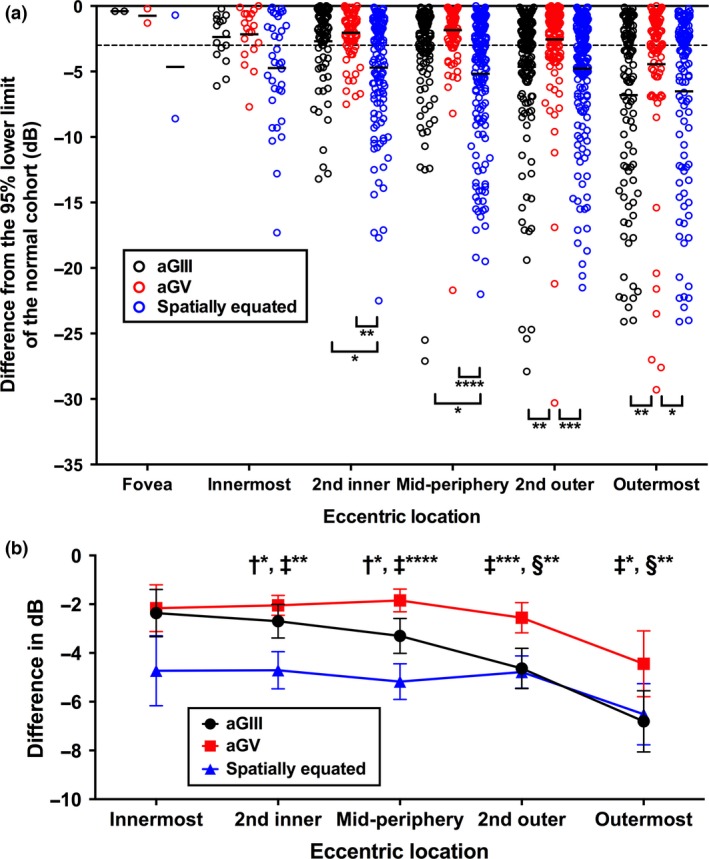
Figure 6.

(a) The magnitude of difference of aGIII (black), aGV (red) and spatially equated stimuli (blue) thresholds from the 95% lower limits of their respective normal cohort values (in dB) for individual points at each eccentric location. A negative difference indicates worse sensitivity. The black solid line indicates no difference (i.e. 0 dB), and the black dashed line indicates −3 dB. Solid lines represent the mean of the magnitude of difference within each group. (b) The mean difference in dB for aGIII, aGV and spatially equated stimuli from the lower limits of 95% distribution of their respective cohort values (in dB) at each location (fovea not shown for clarity). Asterisks indicate the level of significance [p < 0.05 (*), p < 0.01 (**), p < 0.001 (***), p < 0.0001 (****)]. The symbols indicate significant pairwise comparisons between the groups (†: significant difference between aGIII and spatially equated stimuli; ‡: significant difference between aGV and spatially equated stimuli; §: significant difference between aGIII and aGV). Error bars indicate the 95% confidence interval.
